India at 75: The evolution of Indian economy and society
Interesting charts on how India has changed in the last 75 years
As India celebrates 75 years of Independence, in this issue, we take a look at some interesting data points about the evolution of the Indian economy.
GDP: At Independence, India's GDP was around Rs. 2.7 lakh crores. The Indian economy has seen a 10-fold increase in the GDP since the economic reforms that took place in 1991. The real GDP of India (adjusted for inflation) stands at Rs. 147.79 lakh crore, while nominal GDP stood at around Rs. 240 lakh crores ($3.17 trillion) making it the 5th largest economy in the world.
Despite the economic growth, our per capita GDP is just about $2277. India and China were roughly equal in the 1990s. Today China’s per capita GDP at $11,188 is about 5 times higher than India.
Forex Reserves: In 1950-51 India’s forex reserves stood at Rs. 1,029 crores which now stand at Rs. 46.17 lakh crores ($573.88 billion)—5th largest in the world.
Dollar to Rupee: In 1947 a US Dollar was equal to Rs. 3.30. Notably, India's rupee was pegged to the UK Pound Sterling, not the US Dollar. As of August 18, 2022, US $1 is equal to Rs. 79.67.
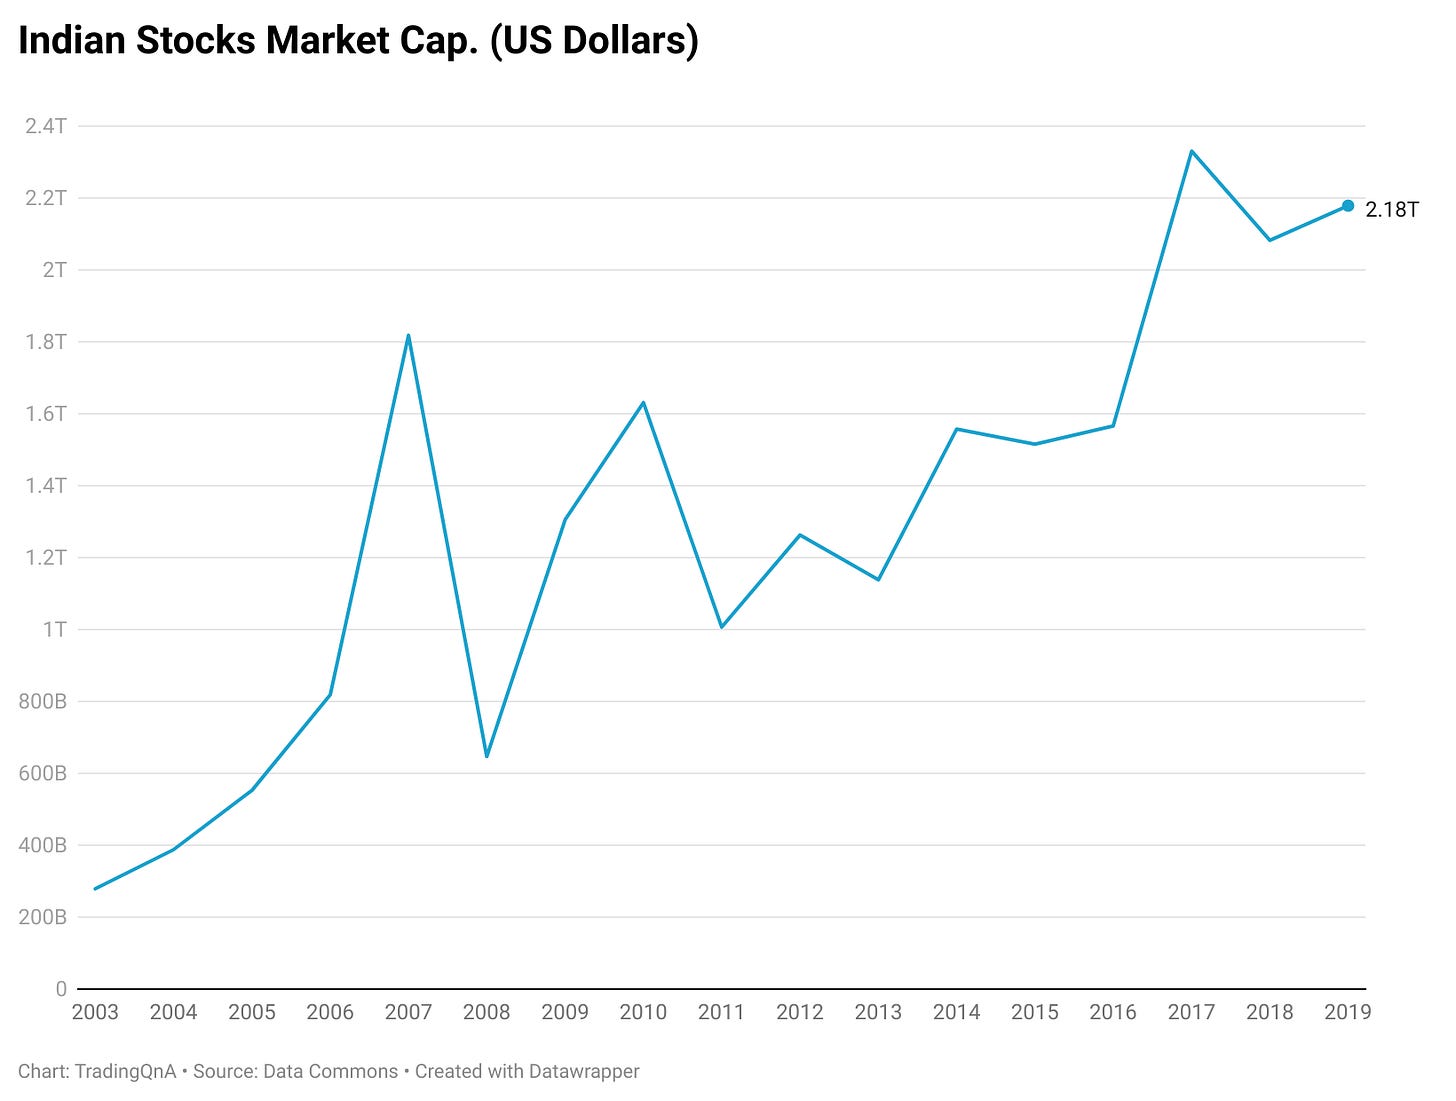
Market Cap.: As of 2019, the market capitalization of companies listed on Indian stock exchanges stood at $2.18 trillion, the 5th highest amongst the Asian peers.
Life Expectancy: In 1947, the expectancy of an average Indian citizen was around 32 years. Today it stands at 70.19 years in 2022. United Nations-World Population Perspective states that the average global life expectancy is 72.98 years. Significant reductions in infant and child mortality rates along with maternal mortality rates have led to an increased life expectancy.
(Source: Macrotrends/UN World Population Prospects)
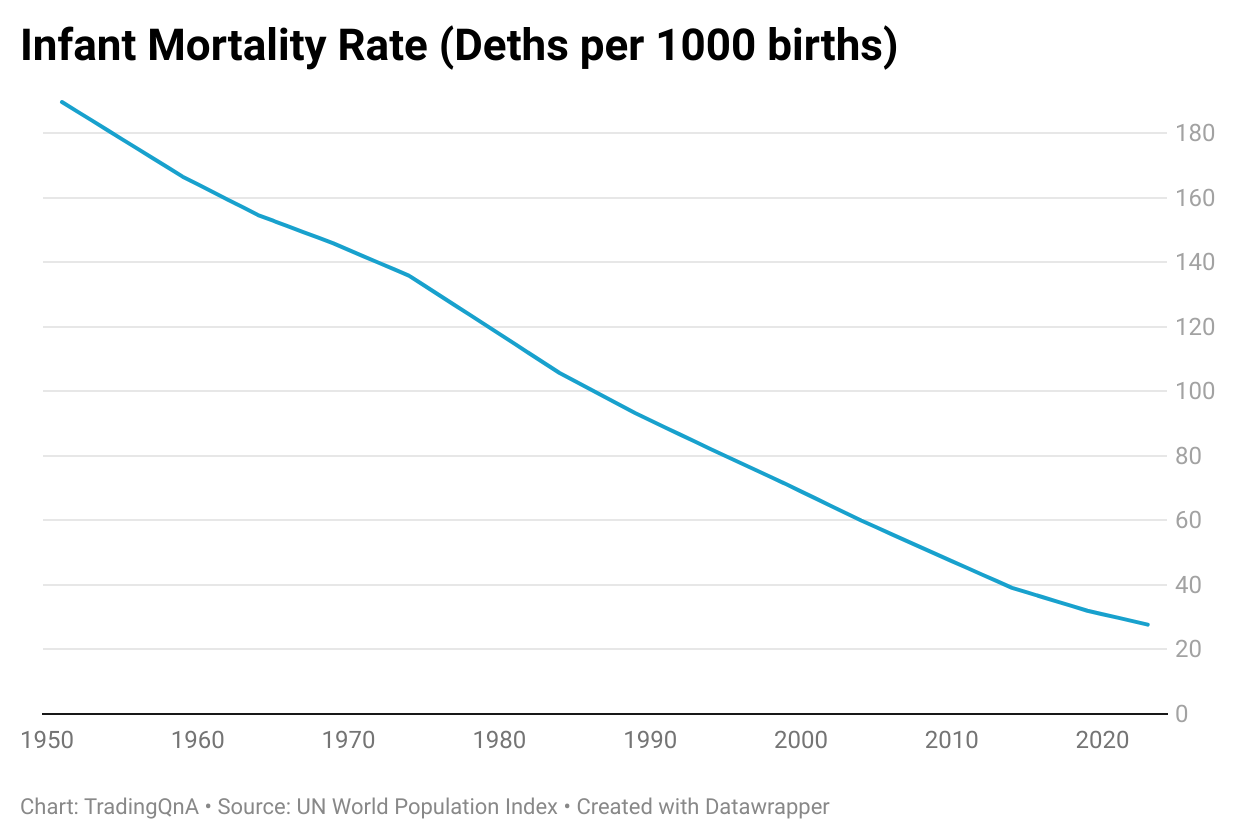
Infant mortality: India’s current infant mortality rate in 2022 is 27.695 deaths per 1000 live births, a significant reduction from 189.629 deaths in 1950.
(Source: Macrotrends/UN World Population Index)
Fertility Rate: The current fertility rate for India in 2022 is 2.159 births per woman. This is much closer to the bare minimum average population replacement ratio of 2.1 as compared to 5.9 in 1950.
(Source: Macrotrends/UN World Population Prospects)
Birth Rate: The current birth rate for India in 2022 is down to 17.163 births per 1000 people from 44.175 in 1950.
(Source: Macrotrends/UN World Population Prospects)
Urban and Rural Population: India’s urban population in 2021 was 493,169,259 (35.39%) as compared to 80,756,165 (17.92%) in 1960. While the rural population in 2021 was 900,239,774 (64.61%) as compared to 369,791,510 (82.08%) in 1960.
(Source: Macrotrends/World Bank)
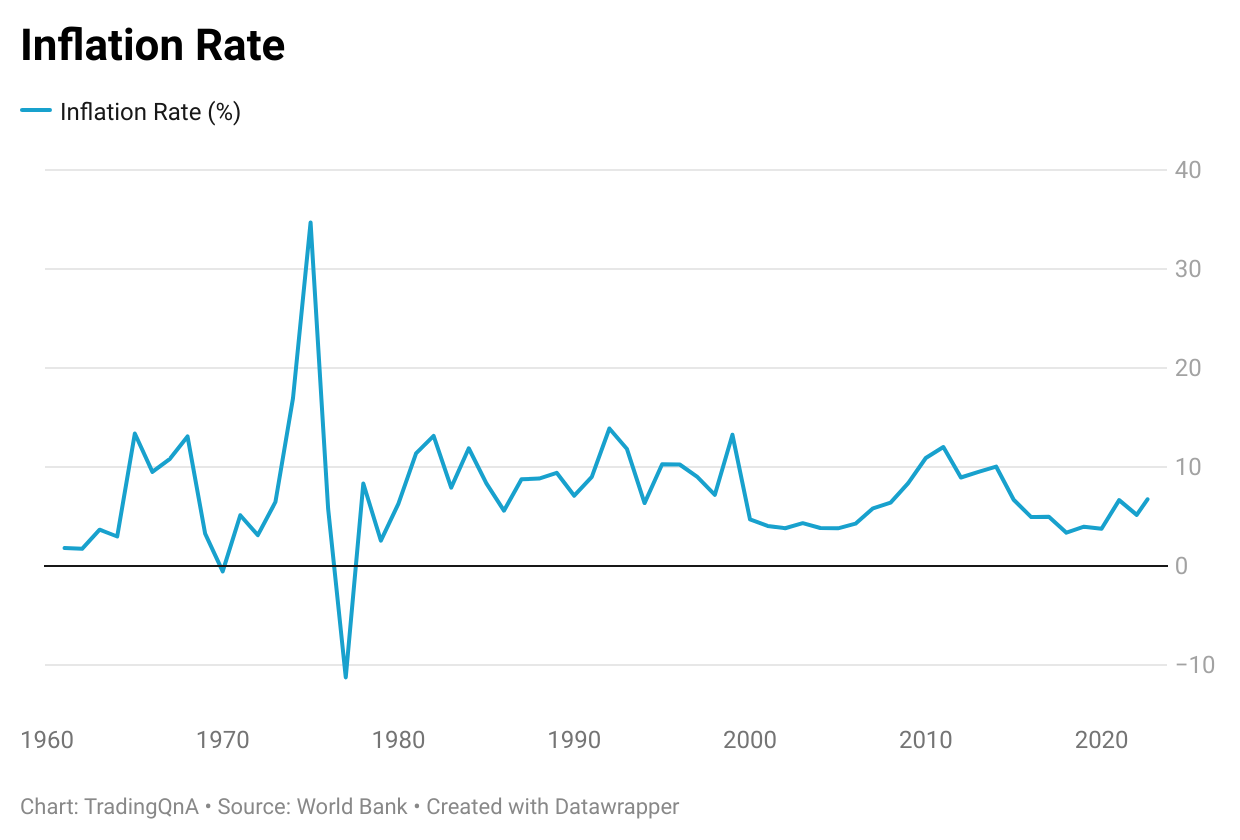
Inflation Rate: India’s current inflation rate stands at 6.71%. The highest inflation that we saw in India was 28.6% in 1974. India was undertaking heavy deficit financing post the 1971 war, and the inflation worsened due to the OPEC oil shocks when oil production was slashed which lead to an increase in oil prices by 3x in 1974.
(Source: Macrotrends/World Bank)
Manufacturing output: India’s manufacturing output has shown significant growth over the years, especially over the past decade. In 2021, the manufacturing output was st $446.50 billion.
(Source: Macrotrencs/World Bank)
Exports and Imports: As of December 31, 2021, India’s exports stood at $660.50 billion, while imports were at $725.55 billion.
(Source: Macrotrends/World Bank)
Literacy Rate: India’s average literacy today is 77.7%. The male literacy rate was 82.4% while the female was 65.8%. This is a significant increase from the 18.3% literacy rate in 1950.
Military spending: India’s defence spending for 2021 was $76.6 billion, making it the third-highest spender after the USA and China. It stood at $0.68 billion in 1960.
(Source: Macrotrends/World Bank)
Roadways: India’s national highway network has increased more than 6-fold since Independence, from 20k km in 1950 to 132k km as of 2020. Overall roadways stood at just 0.4 million km in 1950 and reached a mark of 6.40 million km in 2021.
Electrification: Power Ministry data suggest that electricity was available in just 3,061 villages in 1950, while every village in India – 5,97,464 villages in total – was electrified by 2018.
Vehicle Ownership: Over the years India has seen a huge increase in vehicle ownership, with 162 of every 1000 people owning two-wheelers and 28 in 1000 owning four-wheelers in 2019.
Bank Deposits: India’s outstanding bank deposits are at 77% of GDP as of 2020, compared to just 9% in 1950.
Foreign Investment: The total foreign investment in India in 1949 stood at Rs. 256 crores. India has recorded the highest ever annual FDI inflow of Rs 6,31,050 crores in the Financial Year 2021-22
Food Production: India has emerged as a net exporter of food. Total Indian food production stood at around 54.92 million tonnes in 1950 and has risen to around 316.06 million tonnes in 2020-21.
Human Development Index (HDI): As per the last Human Development Report, the HDI Rank of India is 131, with a score of 0.645. Between 1990 (when it was first computed) and 2019, India's HDI value increased from 0.429 to 0.645, an increase of 50.3 per cent.
(Source: UN Development Program)
Internet Access: In the past 20-odd years that the Internet has been accessible to the public, India has provided access to 47% of its population by the start of 2022.
Healthcare spending: India’s expenditure on the healthcare sector stood at Rs. 4.72 lakh crores in 2021-2022.
Reading Recommendations
A chronological look at the various market milestones India has reached in the last 75 years: India at 75: 20 milestones for Indian markets between 1995 and 2002
Thank you for reading. Do let us know your feedback in the comments below and share the post if you liked it.
If you have any queries related to trading, investing and anything related to stock markets, post them on our forum.
For more, follow us on Twitter: @Tradingqna


Please add chart of Income tax payers per thousand. This shall shows increases in riches
Very Nice article. What is really interesting is the resilience of the Indian economy surviving systemic shocks like demonetisation, pathetic tax reform implementation and a border war with China. Our first growth spurt in 1990s had sputtered after Pokhran and Kargil, relative to the world. We are growing consistently after our second bottom in 1999/2000. The next few decades would be truly exciting.For me the biggest threat before our 100th I Day is growing majoritarianism and loss of democracy and destruction of institutions.