Hello folks, welcome to the latest issue of the Markets and Macros by TradingQnA. In this issue, we take a look at;
Insights from RBI bi-monthly surveys
Interest rates and inflation
A look at easing the global food prices index and much more…
On 5th August, the RBI released the following 7 surveys based on the feedback received from the respondents. We take a look at some of the key highlights from these surveys.
Consumer Confidence Survey (CCS)
The CCS for the July 2022 round obtains current perceptions (vis-à-vis a year ago) and the year ahead expectations on the general economic situation, employment scenario, overall price situation, and own income and spending across 19 major cities based on 6,083 responses. Based on these responses the Current Situation Index and Future Expectation Index have been plotted below. A value below 100 denotes that people are pessimistic while a value above 100 denotes that people have an optimistic outlook.
Consumer confidence continued to recover after the historic low recorded in July 2021. Though it remained in the pessimistic zone. In the latest survey, the Current Situation Index (CSI) rose by 1.4 points on account of improved perception of employment, household income, and spending.
Households’ Inflation Expectations Survey
Based on the responses from 5,935 urban households. The Households’ median inflation perception for the current period moderated by 80 basis points to 9.3% in the latest survey round.
Their 3 months and 1-year ahead median inflation expectations also declined by 50 basis points and 60 basis points from the May 2022 round of the survey.
Order Books, Inventories, and Capacity Utilisation Survey (OBICUS) on the Manufacturing sector
This OBICUS provides a snapshot of demand conditions in India’s manufacturing sector from January-March 2022. The survey covered 765 manufacturing companies.
At an aggregate level, the capacity utilization in the manufacturing sector rose to 75.3% in the fourth quarter of FY22, from 72.4% recorded in the previous quarter, showing improvement for the third successive quarter. Indicating a steady increase in the aggregate demand.
Industrial Outlook Survey of the Manufacturing Sector
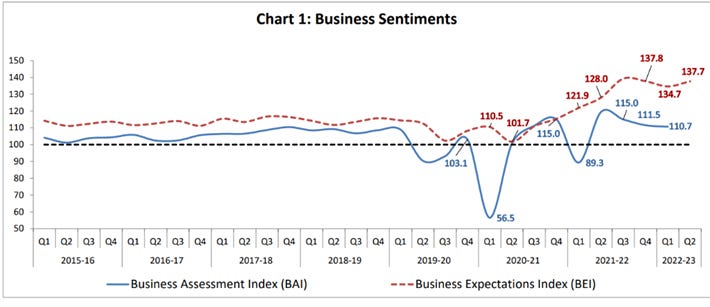
The Industrial outlook survey of the manufacturing sector captures a qualitative assessment of the business climate of Indian manufacturing companies. This survey is based on responses from 1,239 companies.
The Business Assessment Index (BAI) pulled back to 110.7 from 111.5, but the overall business sentiments in the manufacturing sector remained positive.
The Business Expectations Index (BEI) showed an increase, surging to 137.7 from 134.7.
The respondents see pressures from the purchase of raw materials, staff cost, and cost of financing continuing in the second quarter of FY23 but expect improvement in pricing power and profit margin. Implying an increasingly positive outlook.
Survey of Professional Forecasters on Macroeconomic Indicators
The RBI has been conducting the professional forecasters' survey since 2007. 42 panellists participated in the survey based on whose responses the following data was tabulated;
The real gross domestic product (GDP) is expected to grow at 7.1% in the financial year 2022-23, with projections being lowered by 10 basis points from the previous survey.
While the GDP growth is projected at 6.3 percent in FY2023-24.
The forecasters have assigned the highest probability to real GDP growth in the range of 7.0-7.4% in the financial year 2022-23. For the financial year 2023-24, the highest probability has been assigned to the range 6.5-6.9%.
Bank Lending Survey
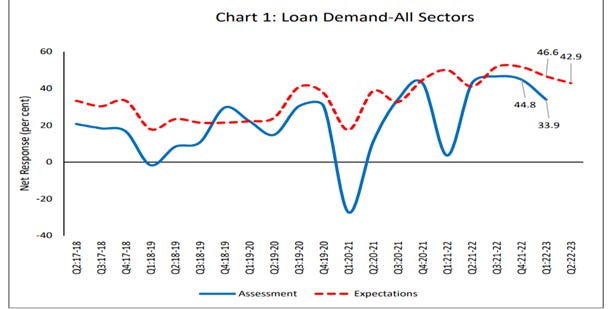
The Bank Lending Survey captures the qualitative assessment and expectations of major Scheduled Commercial Banks on credit parameters such as the loan demand and terms & conditions of loans for major economic sectors. The latest survey provides an assessment from senior loan officers on credit parameters for Q1 of FY23 and expectations for Q2 FY23.
Bankers’ assessment of loan demand in the first quarter of FY23 remained positive for all major sectors though the sentiments were somewhat toned down from the level reported in the previous quarter.
Bankers were positive on loan demand from all major sectors during the second quarter of FY23, though the level of optimism was somewhat lower than the previous survey round.
Services and Infrastructure Outlook
This forward-looking survey captures qualitative assessment and expectations of Indian companies in the services and infrastructure sectors on a set of business parameters relating to demand conditions, price situation, and other business conditions.
In the latest round of survey 1, 758 companies provided their assessment for the first quarter of FY23 and expectations for the second quarter of FY23.
The firms in the services sector saw improvement in their overall business situation and turnover in the first quarter of FY23. However, the companies remained pessimistic on profit margins owing to pressure from the cost of finance, input prices, wages, etc.
Coming to expectations for the second quarter of FY23, the companies in the services sector are optimistic about demand conditions and turnover. However, they expect cost pressures to continue with rising selling prices.
The companies in the infrastructure sector revealed positive assessments of the overall business situation. Cost pressures intensified in the first quarter of the current fiscal along with a marginal uptick in sentiments for rising selling prices. Though the perception of profit margins remained downbeat.
While the companies remain optimistic about the overall business situation but expect the cost pressure to continue and selling prices are expected to rise further.
During the pandemic, central banks around the world took unprecedented measures to ease financial conditions and support economic recovery, including interest-rate cuts, pumping liquidity into the markets, etc. Add to this Russia’s invasion of Ukraine, which has put pressure on commodity prices.
All these factors have seen inflation rise to multi-decade highs in many countries and have got central banks around the world to tighten their policies this year to tame inflation, as the above chart shows.
Last week, the Reserve Bank of India raised interest rates by another 0.5 percent to 5.25%, the highest since pre-pandemic levels.
Globally, the Bank of England too hiked interest rates by 0.5 percent to 1.75%, the highest since 2008. And also presented a grim forecast of inflation hitting 13 percent and warned that a long recession could start later this year.
The US Fed since March has hiked rates to 2.25% from 0.25%. The highest since 2019. While the European Central Bank raised interest rates for the first time in 11 years, bringing them to 0% from negative territory.
While this might still be early days but the latest inflation numbers reported by India and US look encouraging. Largely thanks to easing commodity prices globally.
The inflation in India eased to 6.71% in July but remained over RBIs tolerance level of 6% for the seventh month in a row.
The inflation in the US eased to 8.5% in July from highs of 9.1% in June.
Here’s how the latest interest rates and inflation numbers look like across economies around the world;
Food inflation shows signs of easing
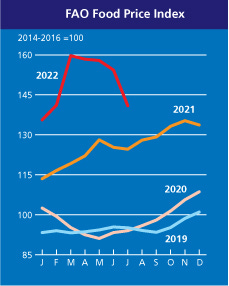
The UN Food and Agriculture Organization’s Food Price Index (FPI) averaged 140.9 points in July, 8.6%; down from its previous month’s level and marking the steepest monthly drop since October 2008.
The FPI – hit an all-time high of 159.7 points in March, the month that followed the Russian invasion of Ukraine. The latest index reading is the lowest since the 135.6 points of pre-war January.
Between March and July, the FPI has cumulatively declined by 11.8%. This has been led by vegetable oils and cereals, whose average prices have fallen even more, by 32% and 13.4% respectively.
Reasons for the inflation: There were 4 major supply-side shock drivers of the great global food inflation: weather, pandemic, war, and export controls.
Weather: Droughts in Ukraine (2020-21) and South America (2021-22) impacted sunflower and soybean supplies while the March-April 2022 heat wave devastated India’s wheat crop.
Pandemic: The pandemic’s supply-side impact was felt the most in Malaysia’s oil palm plantations (2nd largest producer and exporter), where migrant labourers from Indonesia and Bangladesh went back and output fell.
War: In 2019-20 (a non-war, non-drought year), Russia and Ukraine accounted for 28.5% of the world’s wheat, 18.8% of corn, 34.4% of barley, and 78.1% of sunflower oil exports.
Export Controls: Russia (December 2020), Indonesia (the world’s No. 1 producer-cum-exporter of palm oil) and India introduced wheat export controls in March-May 2022.
Why the sudden ease? The UN-backed agreement for unblocking the Black Sea trade route allows for shipments of Russian food and fertilizers. Russia alone is expected to export 40 million tonnes (mt) in 2022-23 (July-June), up from last year’s 33 mt.
Indonesia has lifted its ban on palm oil exports.
The US, Brazil, Argentina, and Paraguay are set to harvest bumper soybean crops.
The changed price sentiment is most visible in edible oils (60% of India’s annual consumption requirement is met through imports).
Domestically too, cumulative rainfall during the current monsoon season has been 5.7% above the historical long-term average for this period.
Apart from bumper crops, a good monsoon also means more fodder and water for animals, reducing livestock input costs and inflationary pressures on milk, egg, and meat.
On TradingQnA
A look at key highlights from the Reserve Bank of India’s monetary policy meeting held last week 👇
Highlights from the RBI monetary policy meeting - August 2022
Reading Recommendations
Investing serves one purpose, and one purpose alone: to increase your wealth over time. When you initially make the decision to invest in anything, you have a thesis. A reason to believe the stock should go up. If that thesis plays out, great. You'll make some money. If it breaks, that sucks, but you should sell and move on to the next one.
But sometimes the stock goes up even though our thesis didn't play out. We were right for the wrong reasons. And we grow confident.
How you confront criticisms about your investment speaks volumes. When you become enamored with your investment, you lose the ability to objectively assess the situation, your investment is no longer an investment. It's an obsession.
While an objective investor can provide their reasoning for any investment, but they are willing to change their mind as the facts change.
Unwavering faith may provide the stairway to heaven, but it has no place in your portfolio. When an investment begins to look like a religion, buyer beware.
Read 👇
It is often said that a useful measure of happiness is the gap between reality and expectations. A similar approach can be adopted for identifying poor investment decisions. They tend to occur when our expectations of what we are capable of exceed the reality. This miscalibration leads us into activities and behaviours that we really should avoid.
This article explores some of the most significant examples of what we think we can do, but probably can’t.
Read 👇
What Do Investors Believe They Can Do But Can’t?
This is it from us today. Thank you for reading. Do let us know your feedback in the comments below and share the post if you liked it.
If you have any queries related to trading, investing and anything related to stock markets, post them on our forum.
For more, follow us on Twitter: @Tradingqna


