Hello all, welcome to the latest issue of Markets and Macros by TradingQnA. In this issue;
Is the Indian banking sector set for a bull run?
Highlights from the Credit Suisse Global Wealth Report 2022
A look at some interesting stats from the RBIs Handbook of Statistics on the Indian Economy and more…
Written by Abhinav, Esha, Bhuvan, Meher and Shubham.
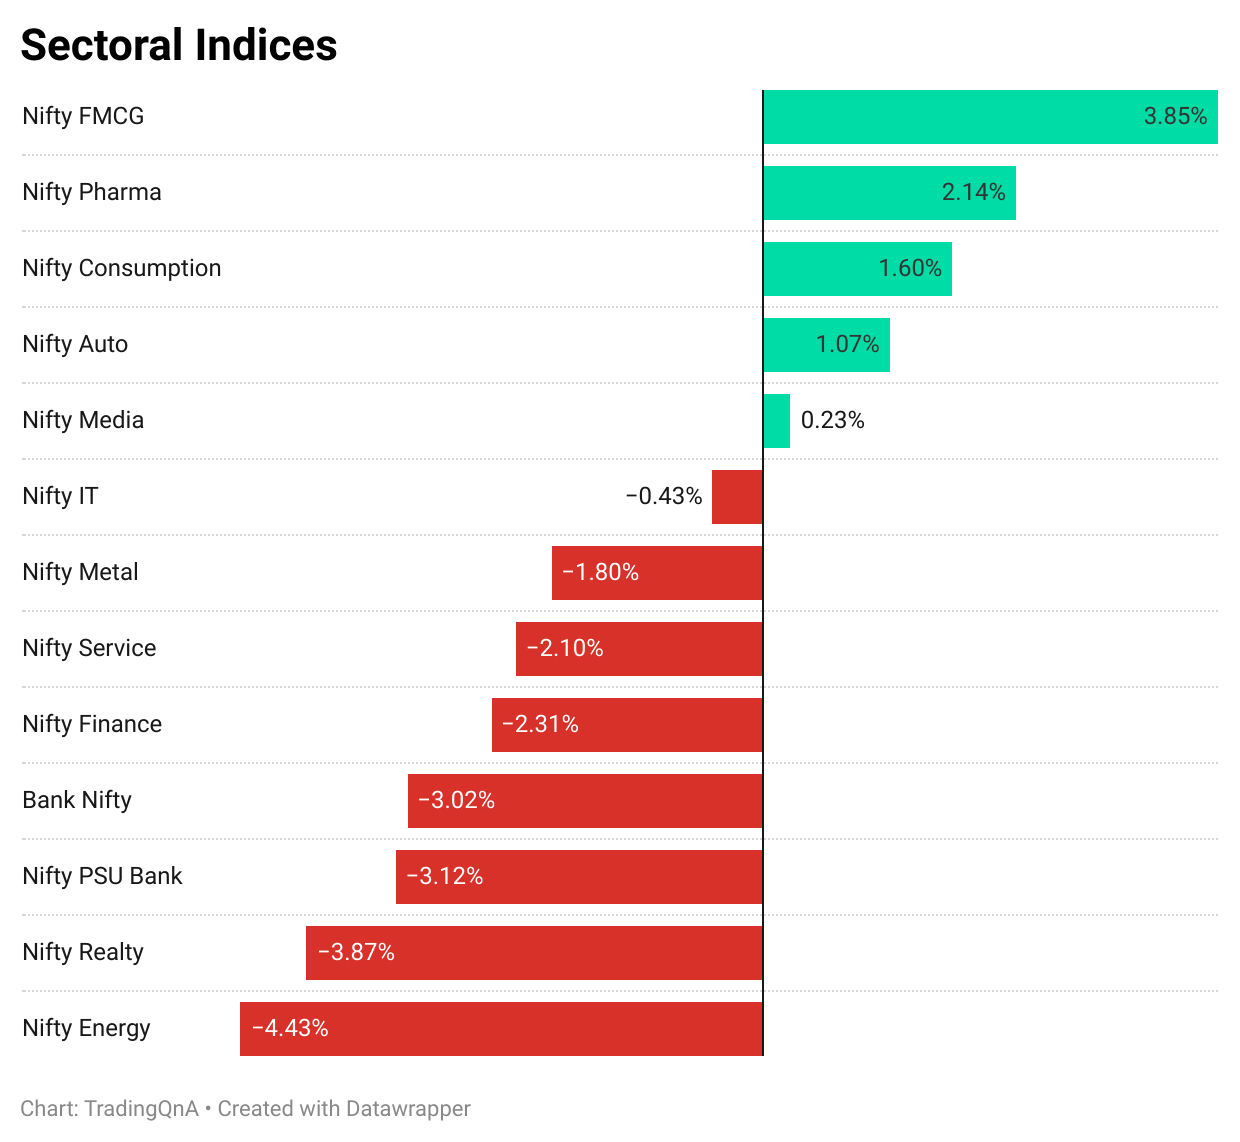
Weekly Market Wrap
A quick look at what the markets were up to in the week;
📰 News
Tata Steel announced that its board has approved the merger of its six subsidiaries and one associate company into a single entity.
The companies include Tata Steel Long Products, The Tinplate Company of India, Tata Metaliks, The Indian Steel & Wire Products, Tata Steel Mining, S&T Mining and TRF Ltd.
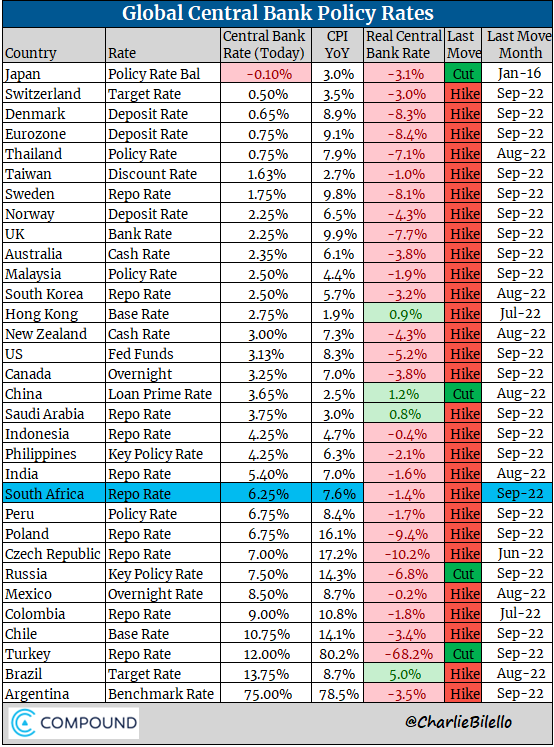
In the latest round of rate hikes, the US Federal Reserve on Wednesday hiked interest rates by 75 bps to take them to 3.25%, taking them above the pre-pandemic levels.
This was followed by the Bank of England which raised rates by 50 bps and the Swiss National Bank, 75 bps. The rates in England now stand at 2.25% and 0.5% in Switzerland.
Here’s what the latest interest rates look like across some major economies;
Is the Indian banking sector set for a bull run?
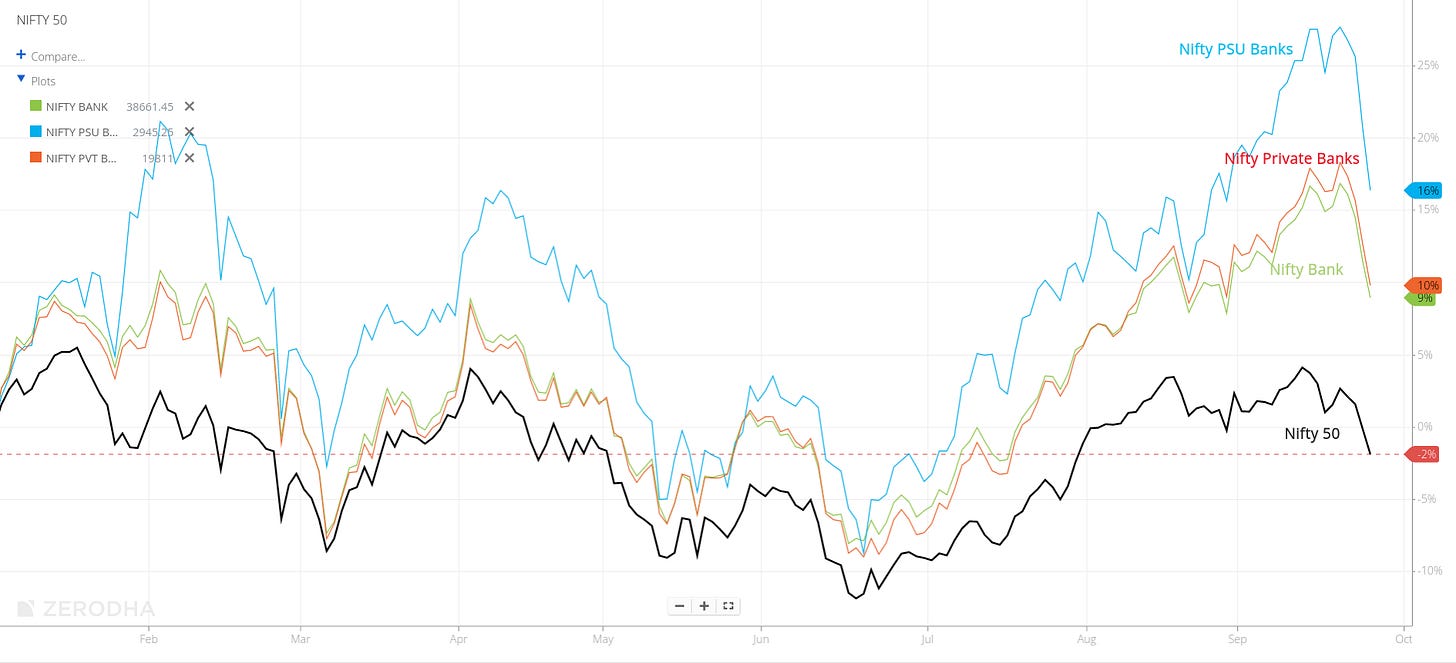
Banking has been one of the stronger performers this year amidst the broader market turbulence. Out of the banking pack, PSU banks have been standout performers after being laggards for a long time. Improved earnings outlook, asset quality, and a pickup in bank credit seem to be the key factors behind the performance.
There were a bunch of reports on the banking sector, here are a few highlights:
Asset quality issues of PSUs seem to have bottomed out.
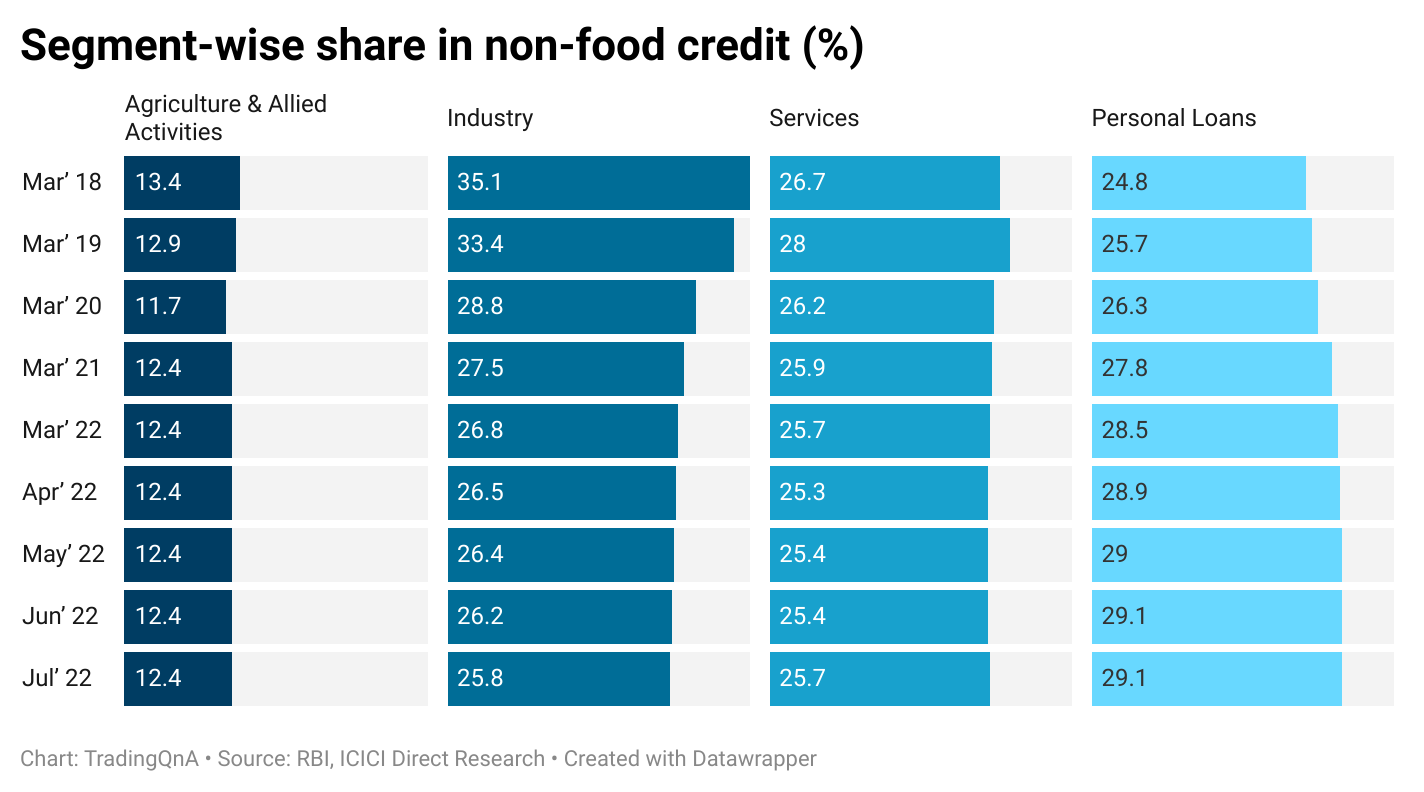
There’s strong credit growth across the board in retail, services and industrial credit.
The performance of PSU banks is in part due to the resolution in non-performing loans, write-offs, sales to asset reconstruction companies and also recapitalization.
Banks have a higher proportion of loans that have been repriced aggressively in a rising environment. The pace of the hike in deposit rates has been much slower compared to the rise in interest rates on loans. This is expected to result in better yields.
Credit growth numbers
Highlights from the Credit Suisse Global Wealth Report 2022
Credit Suisse released its Global Wealth report provides analyses of global household wealth. The 2022 edition reviews the impact of the response of policymakers to the COVID-19 pandemic on global household wealth through 2021 and its distribution across regions, as well as within countries and also takes account of the flattering effect of inflation on global wealth.
By 2021 end, global wealth totalled an estimated $463.6 trillion, an increase of 9.8% versus 2020 and above the average annual 6.6% growth recorded since the beginning of the century.
On a country-by-country basis, the United States added the most household wealth in 2021, followed by China, Canada, India and Australia.
Distribution of the wealthy
The US has 24.5 million millionaires (39% of the world’s total). The number of US millionaires increased by 2.5 million in 2021, the largest increase recorded for any country in any year, reinforcing the rapid rise in millionaires seen in the US since 2016.
China is in 2nd place (10%) followed by Japan(5.4%), the UK (4.6%) and France (4.5%).
Switzerland was once again named the richest country in terms of mean average wealth per adult at $700,000, ahead of the US at $579,000.
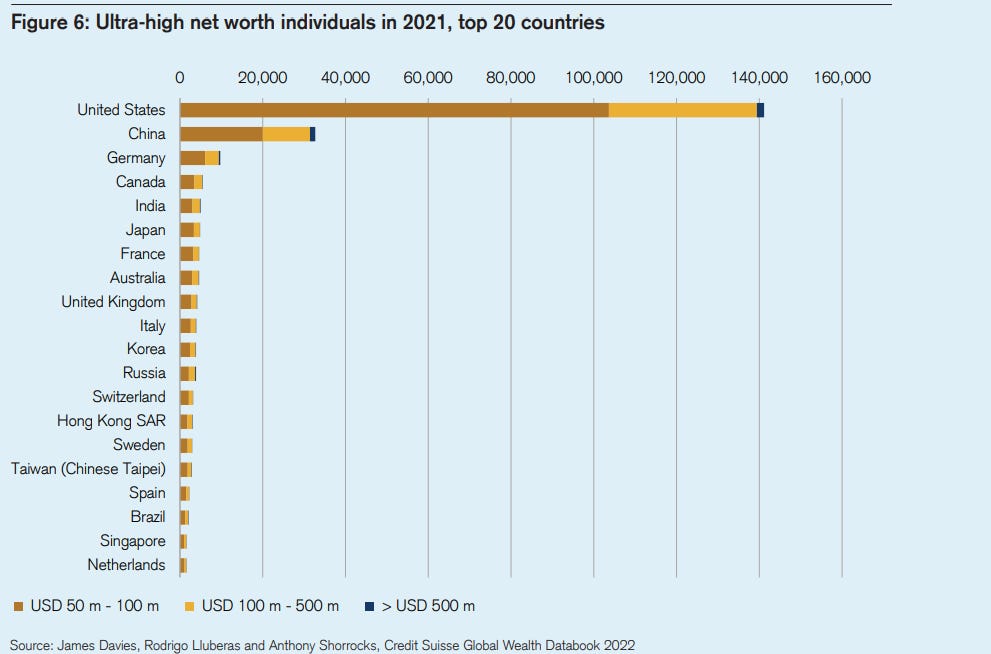
Ultra High Net Worth (UHNV) Individuals
Global UHNW individuals (those with assets of more than $50m) swelled by 46,000 last year to a record 218,200.
The UHNW bracket has increased by more than 50% over the past 2 years.
Concerns about inequality
Rising inequality can be attributed to the surge in the value of financial assets during the pandemic.
The richest 1% of the global population increased their share of all the world’s wealth for the 2nd year running to 46%, up from 44% in 2020.
Globally, the number of USD millionaires increased by 5.2 million in 2021 to a total of 62.5 million.
It is interesting to note that Australia is at the top of the median wealth table with $274,000 while New Zealand saw the biggest jump in mean average wealth ($114,000 average increase).
India
India is home to about 1% of the world’s millionaires (7.96 lakh millionaires, which is expected to grow 105% to 16.32 lakh by 2026).
Wealth per adult in India has risen at an average annual rate of 8.8% since 2000 but stood at $15,535 at the end of 2021, which is far below the global mean.
Financial assets only account for 23.2% of the total assets in India.
Financial assets per adult increased by 6.4%, while non-financial assets rose 10.5%, generating a 9.5% increase in total assets per adult.
At the same time, there were increases of 3.4% in debt and 10.1% in net worth.
Wealth inequality in India is very high. The Gini Coefficient rose from 74.6 in 2000 to 82.3 at the end of 2021.
The wealth share of the top 1% went up from 33.2% in 2000 to 40.6% in 2021.
What can be expected in the future?
Rises in interest rates in 2022 have already had an adverse impact on bond and share prices and are also likely to hurt investment in non-financial assets; however, in the longer term, growth will recover. The report says that global wealth is expected to increase by $169 trillion by 2026, a rise of 36% from last year.
The beneficiaries will be more spread out globally, the report predicted. “Low and middle-income countries currently account for 24% of the wealth but will be responsible for 42% of wealth growth over the next five years. Middle-income countries will be the primary driver of global trends” Credit Suisse said.
Highlights from RBI’s Handbook of Statistics on the Indian Economy
The RBI recently released its annual publication titled “Handbook of Statistics on the Indian Economy, 2021-22”. This is the 24th publication in the series which covers time series data on major economic and financial indicators relating to the Indian economy.
Here are some interesting charts based on the data from the handbook.
🐦 Interesting bits from Twitter


📖 Reading Recommendations
Incentives: The Most Powerful Force In The World by Morgan Housel
Incentives are the most powerful force in the world and can get people to justify or defend almost anything.
When you understand how powerful incentives can be, you stop being surprised when the world lurches from one absurdity to the next.
It Starts With Inflation by Ray Dalio
Over the long term, living standards rise because of people inventing ways to get more value out of a day's work. We call this productivity. The ups and downs around that uptrend are mostly due to money and credit cycles that drive interest rates, other markets, economic growth, and inflation. All things being equal, when money and credit growth are strong, demand and economic growth are strong, unemployment declines, and all that produces higher inflation. When the opposite is true, the opposite happens.
That’s it from us today. Hope you loved reading the latest issue, do let us know your views in the comments section below. And do like and share 😃
If you have any queries related to trading, investing and anything related to stock markets, post them on our forum.
For more, follow us on Twitter: @Tradingqna









Really nice work! I’d also love to pitch as Im also passionate about writing in my spare time, about macros across the globe. I’ve good research and love to read about macro economic environment around the globe. If you’d like to read my work, I’d be happy to share it with youll.