Hello folks, Abhinav, Shubham, Meher, and Bhuvan here. We hope that you have found the Markets and Macro newsletter useful. This is the 4th issue and we would love to hear some feedback. So please do leave a comment.
We got an interesting issue this week for you:
Is this the final dance? Will Jeremy Grantham be finally right this time?
Looking under the hood of India’s latest GDP growth numbers
China’s looming economic crisis and more…
Is this the final dance?
If you haven’t heard of Jeremy Grantham, he’s one of the founders of the storied investment management firm Grantham, Mayo, & van Otterloo (GMO). He’s best known for predicting the Japanese crash, the dot-com bubble, and the 2008 crisis. He regularly publishes investment memos that are widely read across the investing world. Last week, he published a memo titled Entering the Superbubble's Final Act that set the internet abuzz. Here are some excerpts from the memo:
My theory is that the breaking of these superbubbles takes multiple stages. First, the bubble forms; second, a setback occurs, as it just did in the first half of this year, when some wrinkle in the economic or political environment causes investors to realize that perfection will, after all, not last forever, and valuations take a half-step back. Then there is what we have just seen – the bear market rally. Fourth and finally, fundamentals deteriorate and the market declines to a low.
Let’s return to where we are in this process today. Bear market rallies in superbubbles are easier and faster than any other rallies. Investors surmise, this stock sold for $100 6 months ago, so now at $50, or $60, or $70, it must be cheap. Outside of the late stage of a superbubble, new highs are slow and nervous as investors realize that no one has ever bought this stock at this price before: so it is four steps forward, three steps back, gingerly exploring terra incognita. Bear market rallies are the opposite: it sold at $100 before, maybe it could sell at $100 again.
in the U.S., the three near perfect markets with crazy investor behavior and 2.5+ sigma overvaluation have always been followed by big market declines of 50%. The papers said nothing about fundamentals except to expect some deterioration. Now here we are, having experienced the first leg down of the bubble bursting and a substantial bear market rally, and we find the fundamentals are far worse than expected.
Damn, that’s some scary stuff. If you are bearish on the markets, I’m sure this will reason with you. But here’s the thing, even perfectly sensible and seemingly rational bear market theses can take decades to play out. Again, you don’t have to look any further than Jeremy Grantham himself. He’s been calling for a market crash since 2010.
Here’s an excerpt from a FT article:
Periodic grumbling about markets being overvalued in 2010, 2011, 2012, 2013, 2014, 2015, 2016, 2017, 2018, 2019, 2020 and 2021 saw him dismissed (once again) as an old permabearish sourpuss. After soaring in the wake of the financial crisis, GMO’s fortunes waned once more, and Grantham stepped back to devote himself to combating climate change.
What’s the lesson here?
Being right and making money in the markets are two separate things.
Predicting markets is hard. This is also the understatement of the millennium.
Betting against the trend is probably the hardest thing to do in the markets. These type of investing strategies are painful.
Global market valuations
There are multiple ways of looking at market valuations, but one of the more popular metrics is the cyclically adjusted price-to-earnings ratio (CAPE). The metric was created by Nobel Laureate Robert Shiller. The CAPE ratio is measured by dividing the price by the 10-year average earnings.
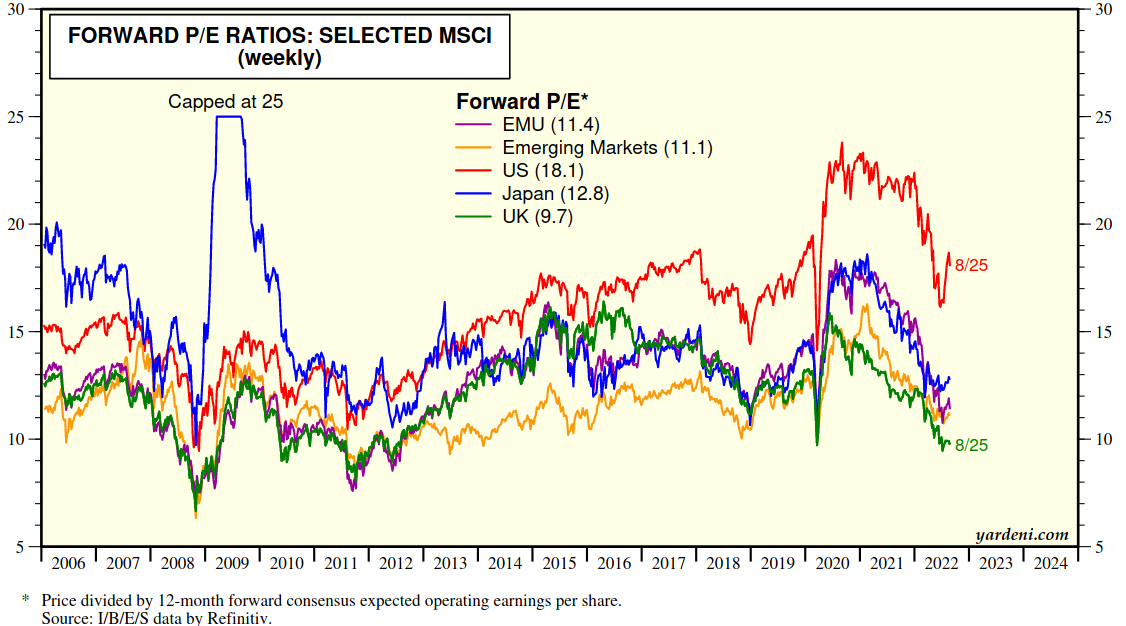
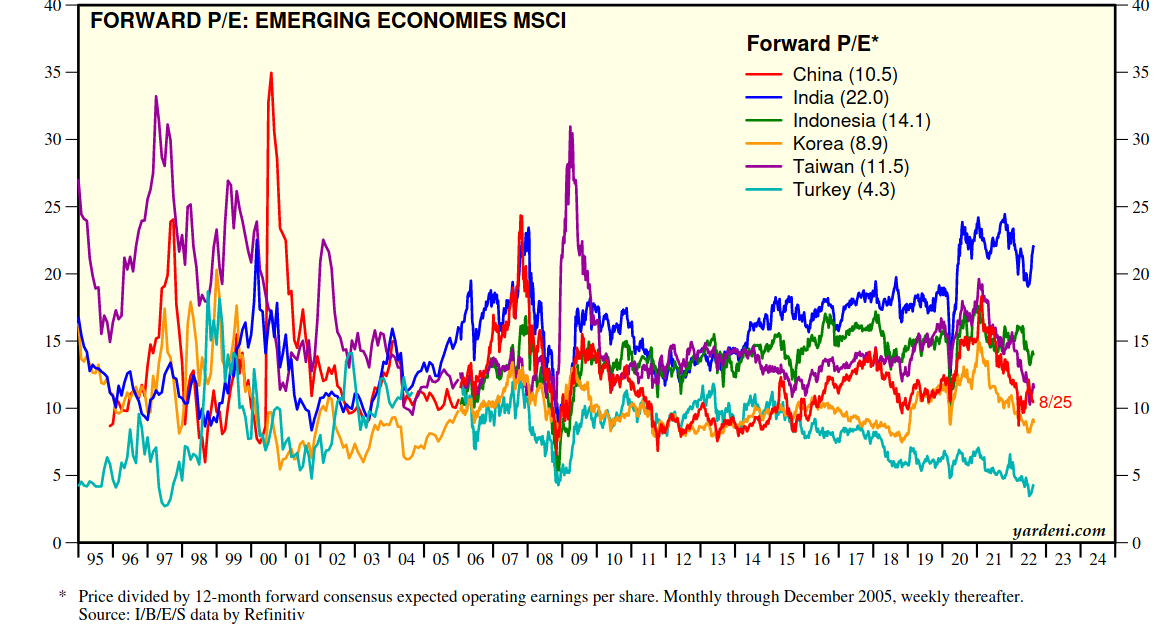
Here’s a more widely followed forward PEs of major regions. If you look at the valuation fall this year, the compression has been swift. But is this the time to start buying in? That’s a very difficult question to answer!
A dive into India’s latest GDP growth numbers
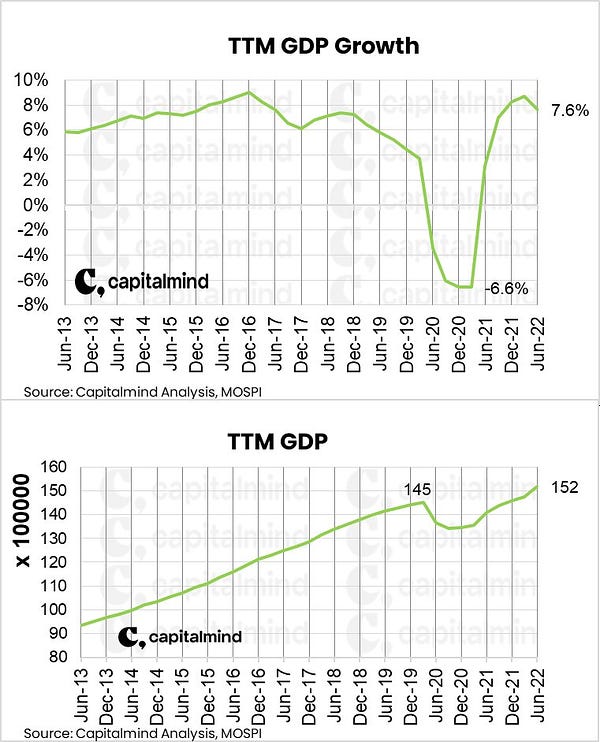
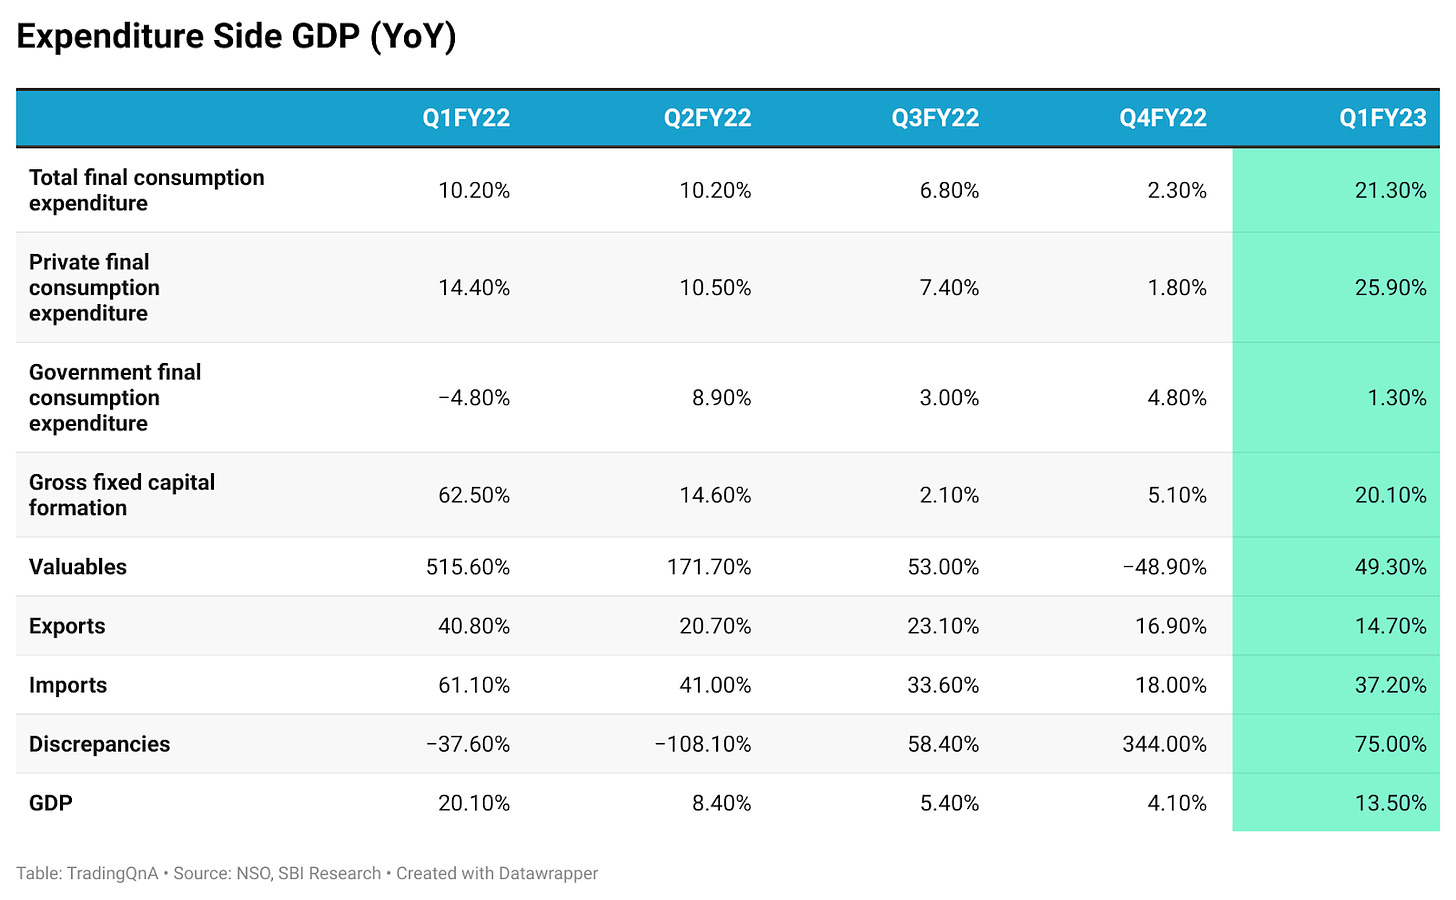
The National Statistics Office (NSO) published the GDP (Gross Domestic Product) numbers for the first quarter of FY23. India’s GDP grew by 13.5% year-on-year in the first quarter of FY23.
Even as the big economies across the world are experiencing a slowdown, double-digit growth in the Indian economy is encouraging, but this was largely due to the favourable base effects.
In the first quarter of FY22, India’s economy had grown by 20.1% which was magnified due to the contraction in economic growth in the first quarter of FY21, which saw Indian GDP decline by -23.8% due to COVID-19.
The GDP growth reading in Q1 of FY23 is the highest growth the Indian economy has seen in the previous four quarters. However, it was lower than the RBI estimates of 16.3% for the quarter.
Compared to the pre-pandemic period of Q1FY20, Indian GDP has recorded modest growth of 3.8%.
The nominal GDP growth, which doesn’t take into account the effects of inflation, stood at 26.7% compared to 32.4% in Q1FY22. This also shows the seriousness of the inflationary spike.
Also, the gross value added (GVA) which is the sum of GDP minus the subsidies and indirect taxes grew at 12.7% year on year.
This Varsity chapter has a brief explainer of GDP. Do check it out.
What's driving the Indian economy?
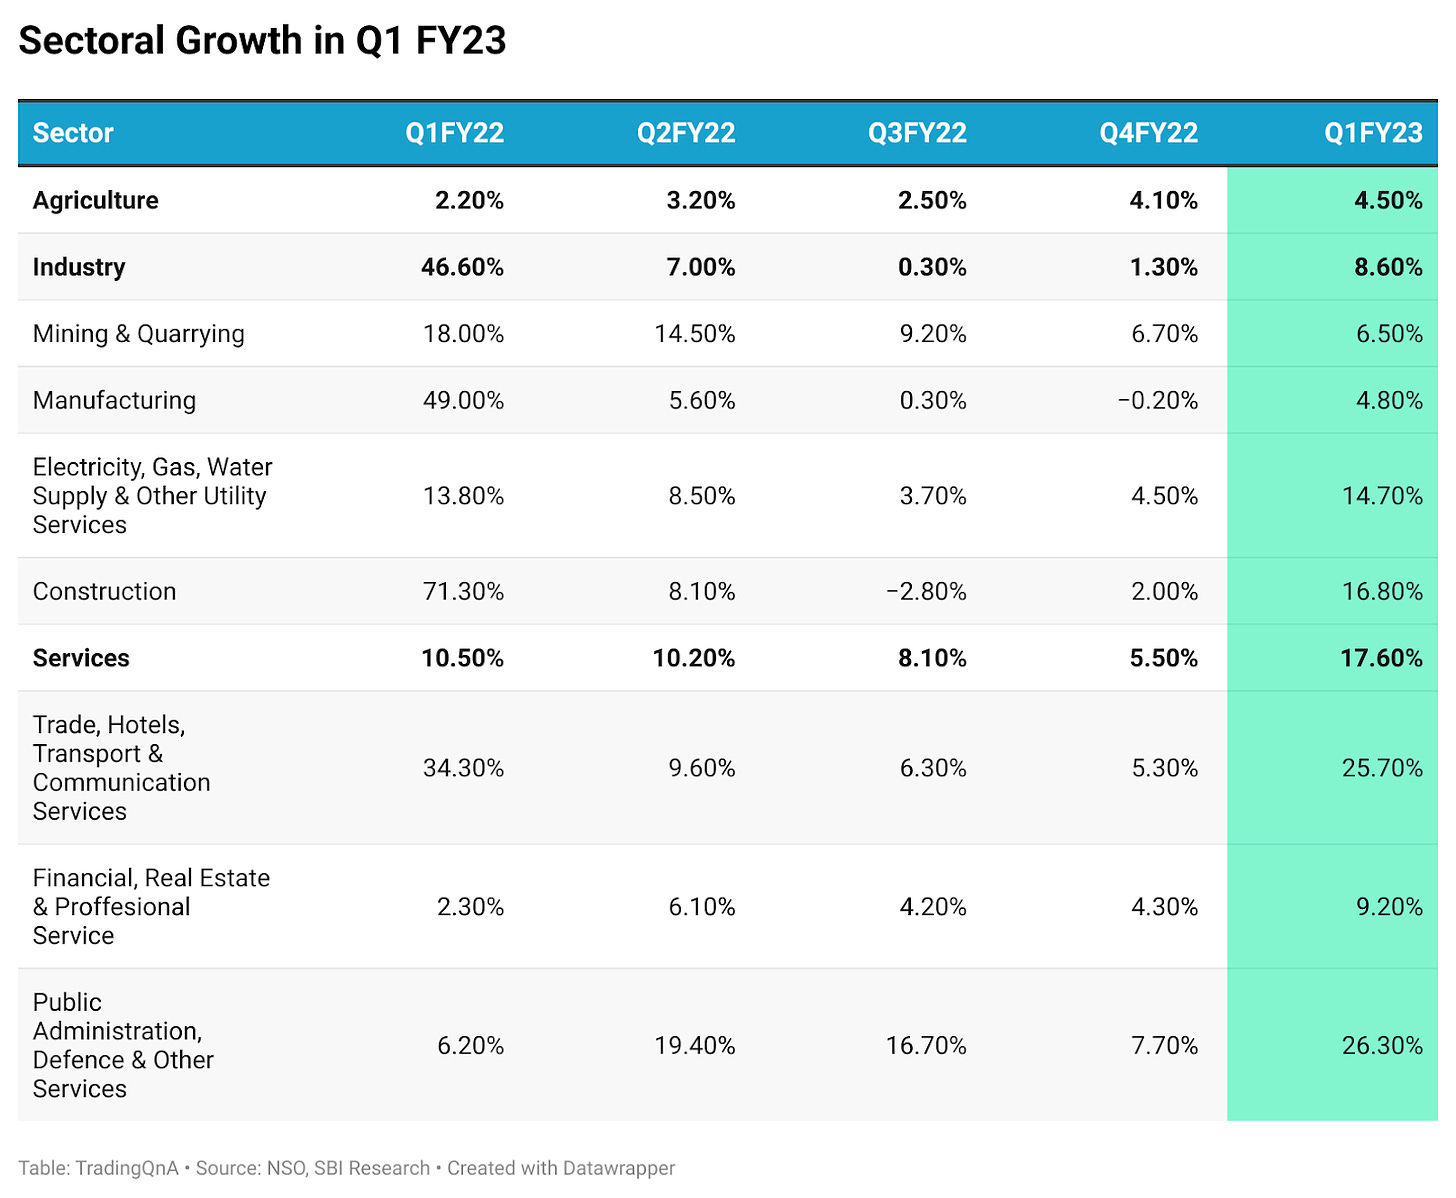
The agricultural sector recorded growth of 4.5% year-on-year in Q1 of FY23 on the back of a low base of 2.2% growth in the same period last fiscal. As per the fourth advance estimate, despite disruptions due to heatwave, overall food production for the crop year 2021-2022 is expected to grow to record highs of 315.72 million tonnes. However, the uneven rainfall impacting the production of major Kharif crops could have implications on the output growth of the sector.
Industrial output jumped by 8.6% YoY in Q1 of FY23 but the sector saw a contraction in growth due to lower output across the mining, manufacturing, and construction sectors.
The services sector recorded a growth of 17.6% in Q1FY23. In this, the trade, hotels, transportation, and communication services saw strong growth of 25.7%, however, this still remains around 15% lower than pre-pandemic levels.
On the expenditure side, private consumption improved, clocking a growth of 25.9% supported by a revival in consumption of services.
The Gross fixed capital formation registered a growth of 20.1%. The capital expenditure by GoI, construction output, and new project announcements showed encouraging signs. However, project completions, capital expenditure by states’ and capital goods output remained subdued, suggesting an uneven recovery in investment demand.
Growth in exports was at 14.7%, a sharp drop compared to Q1 in FY22. While the net imports, on the other hand, rose to 37.2%. The drag of net exports on GDP deepened to Rs. 3 trillion from Rs. 1 trillion in Q1 of FY22 due to the net growth of imports sharply outpacing exports in Q1 of FY23.
(Source: SBI Research, ICRA, CARE Edge)
Related Reads:

China’s looming economic crisis
In the last edition of the newsletter, we talked at length about the brewing trouble in the Chinese economy. In this edition, we explore the Chinese economy further.
Reduction in GDP forecasts
Moody’s has lowered China’s GDP growth forecast for 2022 to 3% in their September baseline update. In August they had lowered the forecast to 3.4% from 4.3%.
According to Bloomberg’s latest quarterly survey of economists, the economy is now projected to grow just 3.5% this year, down from a previous forecast of 3.9%,
The government had originally set a GDP growth target of around 5.5% this year. Beijing hasn’t missed its GDP target by such a large magnitude before.
What about the recent stimulus package and interest rate cuts?
China has recently released a CNY1 trillion ($144 billion) stimulus package announced on 24 August. Along with it, China is cutting interest rates to boost growth.
China’s go-to policy response, when faced with downturns, has been to pump as much credit as possible, but there are limits to it. With an already over-leveraged private sector, stimulus won’t fix China’s issues. If anything, large swathes of the Chinese economy need serious deleveraging.
China's annual inflation rate rose to 2.7% in July 2022 from 2.5% in June. This was the fastest rise in consumer prices since July 2020, mainly due to a surge in food prices. Even though this is much lower than what the other economies are experiencing, China still needs to be cautious about cutting interest rates.
Why is China’s inflation rate so low?
The broad CPI measure hit a 2-year-high. But the core inflation which excludes food and energy is flat, showing how depressed demand and consumer confidence is.
The weak property sector (covered in our previous newsletter), rolling shutdowns of major industrial hubs (Chengdu, home to 21 million people and ~1.7% of China's GDP was just locked down), rising unemployment (China's youth jobless rate hit a record high of 19.9%), weakening global and domestic demand are all leading to decreased inflation.
Reduced consumer spending
After the Shanghai lockdown was eased in June, consumer spending still has not seen a V-shaped recovery (retail sales grew just by 2.7% in July from a year ago, well below the 5% growth forecast and down from growth of 3.1% in June). This reflects a downbeat sentiment.
Hopes of recovery will be hampered by the recent lockdown in Chengdu as more Chinese citizens will prefer to cut down on consumption and increase their savings anticipating further complete lockdowns across the country, which will also keep inflation in check.
Data from the banking industry
The banking industry, which is being pushed to lend more at lower rates, reported a record 2.95 trillion yuan in bad debt. The struggling real estate market makes up about 38% of the Bank of China's total loans.
Is climate change hurting china?
China is facing its worst heatwave on record and drought leading to weakened hydroelectricity production and hurting industrial production (reflected in August’s weaker-than-expected manufacturing PMI of 49.4). Moody’s had earlier expected the manufacturing PMI to climb to 49.8 from 49 in July.
Clean Energy Crisis
Centers such as Sichuan, which rely on hydroelectricity for around 80% of their electricity generation, might have to boost their reliance on fossil fuels. This adds to the pressure on China on the climate change front as China is already the largest emitter of greenhouse gases, with per capita emissions now surpassing those of the EU.
Related Reads:


Introducing Varsity Certified


Reading Recommendations
Risk exists in every single aspect of our lives. It is a strange beast that means different things to different people. And that is why, when evaluating what the risk of a situation is or a particular asset allocation or an investment product, you need to view in a very specific context and how it fits in with your goal. You cannot efficiently evaluate risks if you are unaware of your goal.
Read 👇
Risk is deeply personal and always contextual by Lissa Ferdinand
Thank you for reading. Do let us know your feedback in the comments below and share the post if you liked it.
If you have any queries related to trading, investing and anything related to stock markets, post them on our forum.
For more, follow us on Twitter: @Tradingqna






Really liked reading this, very informative and backed with data. Keep at it... waiting for the next one.